The fidelity 500 index fund remains in focus for U.S. investors as FXAIX continues to track the S&P 500 while maintaining an exceptionally low 0.015% expense ratio. A market update published August 14 reported a 0.65% gain for FXAIX, highlighting renewed attention on the fund’s performance and its widening cost advantage over higher-fee alternatives.
Latest FXAIX Update
FXAIX is the ticker symbol for Fidelity 500 Index Fund, a mutual fund designed to provide investors with returns that closely correspond to the performance of the S&P 500.
The fund normally invests at least 80% of its assets in stocks included in the S&P 500. That gives shareholders exposure to a broad group of large U.S. companies through a single mutual fund.
The latest market report available August 14 said FXAIX climbed 0.65%. The report placed its net asset value at $271.20 following another advance in the S&P 500. Because mutual funds calculate their official net asset values at the end of the trading day, intraday movements should not be treated in the same way as continuously traded ETF prices.
Fidelity’s official fund information shows an expense ratio of just 0.015%, effective April 29, 2026. That works out to approximately $0.15 for every $1,000 invested over a year, before considering investment gains or losses.
Why the 0.015% Expense Ratio Matters
Cost remains one of the most important features of FXAIX.
An expense ratio of 0.015% is extremely small for an investment fund. On a $10,000 balance, the annual expense represented by that ratio is about $1.50. On $100,000, it is approximately $15.
Those numbers can look insignificant in isolation. Over long investment periods, however, even small recurring expenses can affect the amount of money that remains invested and compounds.
FXAIX’s current expense ratio is also below the expense ratios commonly associated with several competing S&P 500 investment products. The difference can be especially relevant to investors who plan to hold an index fund for many years.
The fund has no 12b-1 distribution or service fee listed on Fidelity’s current fund page. Fidelity also lists a $0 minimum investment for the fund.
FXAIX and the S&P 500
The investment strategy is straightforward.
FXAIX seeks to replicate the performance of common stocks included in the S&P 500. The index itself contains 500 leading companies and covers approximately 80% of available U.S. market capitalization.
This structure means investors are not buying a fund focused on one industry. Instead, the portfolio spans multiple sectors represented within the benchmark.
The approach also means the fund’s performance will generally remain close to the S&P 500, although expenses and other fund-level factors can create small differences.
Fidelity’s June 30, 2026 data illustrates that close relationship. FXAIX posted a 22.31% one-year return, compared with 22.32% for the S&P 500 benchmark. Its three-year annualized return was 20.60%, versus 20.61% for the index.
The five-year annualized return stood at 13.39%, compared with 13.41% for the benchmark. Over 10 years, FXAIX returned 15.49% annually, while the S&P 500 returned 15.51%.
Those figures demonstrate how closely the fund has followed its benchmark.
Fund Size Continues To Stand Out
FXAIX is also notable for its enormous asset base.
Fidelity reported portfolio net assets of approximately $827.5 billion as of June 30, 2026. The fund held 508 securities and represented 502 issuers at that date.
That scale makes FXAIX one of the largest U.S. index mutual funds.
The fund was launched in 1988, giving it a long operating history through multiple market cycles. The current FXAIX share class began in 2011.
Its long history also provides investors with substantial historical performance data. However, past performance does not guarantee future results.
Technology and Mega-Cap Stocks Have Major Influence
Although FXAIX provides exposure to hundreds of holdings, its results are influenced heavily by the largest companies in the S&P 500.
Fidelity’s June 30 portfolio data showed NVIDIA as the largest holding at 7.51%. Apple represented 6.59%, while Alphabet’s combined Class A and Class C positions represented 5.84%.
Microsoft accounted for 4.30%, Amazon represented 3.62%, and Broadcom accounted for 2.77%. Other major positions included Meta Platforms, Tesla and Micron Technology.
The 10 largest issuers accounted for 37.88% of the portfolio at the end of June.
This concentration is an important characteristic of an S&P 500 fund.
Investors receive broad exposure, but the largest companies can have a substantial effect on overall returns. When mega-cap stocks perform strongly, FXAIX can benefit significantly. If those companies fall sharply, they can also weigh on the fund.
Recent Performance Remains Strong
The latest completed quarter-end performance data shows that FXAIX has delivered strong returns across several time periods.
As of June 30, 2026, the fund’s average annual returns were:
| Period | FXAIX Return | S&P 500 Return |
|---|---|---|
| 1 year | 22.31% | 22.32% |
| 3 years | 20.60% | 20.61% |
| 5 years | 13.39% | 13.41% |
| 10 years | 15.49% | 15.51% |
| Since inception | 11.34% | 11.46% |
The narrow differences between FXAIX and its benchmark are consistent with its index-tracking strategy.
The fund does not attempt to select stocks in an effort to outperform the S&P 500. Instead, its objective is to deliver results that correspond closely to the benchmark.
That simplicity is a major reason index funds remain popular among long-term investors.
FXAIX Is a Mutual Fund, Not an ETF
One important distinction for investors is that FXAIX is a mutual fund.
It does not trade throughout the day like an exchange-traded fund. Mutual fund shares are generally bought and sold based on the fund’s calculated net asset value.
This structure can make FXAIX particularly convenient for investors making regular contributions to a long-term portfolio.
The difference also matters when comparing FXAIX with S&P 500 ETFs. ETFs can trade at market prices throughout the trading session, while mutual fund transactions use the applicable daily NAV.
Investors should therefore avoid comparing a mutual fund’s quoted NAV directly with an ETF’s intraday market price as though they were identical measurements.
FXAIX Compared With SPY on Cost
The latest market discussion has also focused on FXAIX’s cost advantage compared with SPY.
SPY is an ETF that tracks the S&P 500, while FXAIX uses a mutual fund structure. Both provide exposure to the same broad benchmark, but their structures and expenses differ.
The August 14 market report specifically highlighted FXAIX’s 0.015% expense ratio as a widening cost advantage relative to SPY.
For investors who prioritize minimizing fund expenses, that difference can be meaningful.
Still, expense ratio alone does not determine which product is more appropriate. Investors also need to consider account type, trading preferences, tax circumstances, transaction costs and whether they prefer a mutual fund or ETF structure.
Dividend Distributions Are Part of the Fund’s Return
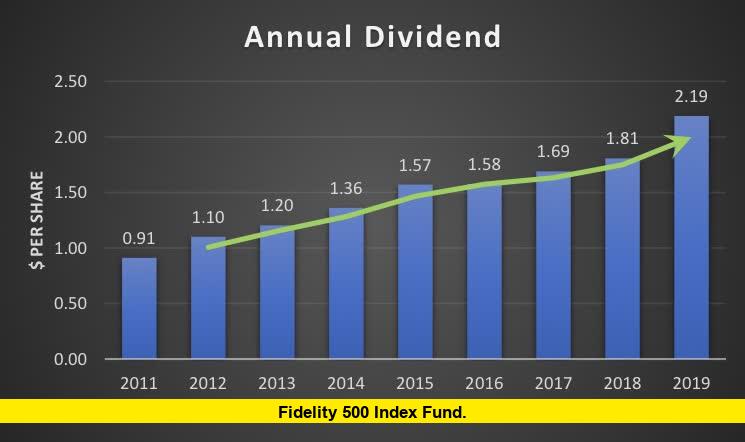
FXAIX also distributes income to shareholders.
Fidelity’s distribution history lists a $0.695 per-share distribution dated July 10, 2026. Earlier distributions included $0.668 per share in April 2026 and $0.725 per share in December 2025.
Dividend distributions are an important part of total investment returns.
Investors who reinvest distributions can use them to purchase additional shares. Over long periods, reinvestment can contribute to compounding.
The actual amount of future distributions is not guaranteed. Dividend payments can change based on the income generated by the underlying portfolio.
What the Latest Data Means for Investors
The latest information paints a clear picture of FXAIX.
It is a large, established S&P 500 index mutual fund with an extremely low expense ratio and substantial assets under management. Its recent and long-term performance has closely followed the benchmark it is designed to track.
The August 14 market update adds another development: FXAIX was reported to have gained 0.65% as the broader S&P 500 reached another record level.
For U.S. investors evaluating an S&P 500 index fund, the combination of scale, low expenses, broad large-cap exposure and close benchmark tracking keeps FXAIX firmly in the conversation.
At the same time, investors should remember that an S&P 500 fund remains an equity investment. Its value can decline when the stock market falls, and the fund does not provide protection against market losses.
Bottom Line
FXAIX continues to stand out because it combines broad exposure to leading U.S. companies with an exceptionally low 0.015% expense ratio. Fidelity’s latest official data shows more than $827 billion in portfolio net assets and performance that has remained very close to the S&P 500 benchmark.
The latest August 14 market report adds to the current picture, reporting a 0.65% rise and renewed attention on the fund’s low operating cost.
For investors researching low-cost S&P 500 exposure, the combination of a long operating history, enormous asset base, broad diversification and minimal expenses makes FXAIX an important fund to understand. Its future returns, however, will continue to depend primarily on the performance of the companies represented in the S&P 500.
What do you think about FXAIX’s ultra-low fee and latest performance? Share your thoughts and stay tuned for the latest confirmed updates.